
Here’s how you can fix it: Track these 7 key metrics to identify underused features and understand why they’re falling short.
Key Metrics to Watch:
- Feature Adoption Percentage: How many users have tried a feature at least once?
- Days Until First Feature Use: How quickly do users interact with a feature after gaining access?
- How Often Features Get Used: Frequency of use reveals true engagement levels.
- Time Spent Using Features: Highlights usability issues or inefficiencies.
- Feature Usage Over Time: Tracks trends - growth, plateaus, or declines in usage.
- User Ratings Per Feature: Satisfaction scores provide direct feedback on feature performance.
- Feature Usage Complexity: Are users fully utilizing features or sticking to basics?
Why These Metrics Matter:
- Spot features with low adoption or engagement.
- Understand barriers like poor visibility, unclear benefits, or complex design.
- Use insights to refine onboarding, improve usability, or promote underused features.
These metrics, combined with user feedback, can help you make data-driven decisions to improve your product and keep users engaged.
Pro Tip: Tools like Userlens make tracking these metrics simple with real-time heatmaps and unified dashboards.
Let’s break down each metric and how it can help you optimize your features.
The Feature Adoption Funnel: How to measure feature usage ...
1. Feature Adoption Percentage
Feature adoption percentage shows how many users have tried a specific feature at least once. This metric can help identify features that might be underused.
To calculate it, divide the number of users who used the feature by the total number of active users, then multiply by 100. For example, if 250 out of 1,000 active users tried a feature, the adoption rate would be 25%.
Why is this important? It helps teams:
- Spot features with low adoption rates, which could mean users don’t understand the value or how to use them.
- Reassess features with poor adoption to improve onboarding or tweak the design for better usability.
- Measure how well onboarding efforts are working by tracking engagement with key features among new users.
When analyzing feature adoption, consider factors like how visible the feature is, whether users are aware of it, any technical hurdles, and how relevant it is to their needs.
From there, look at how quickly users start engaging with new features to refine your onboarding approach.
2. Days Until First Feature Use
This metric tracks how quickly users interact with a feature after gaining access. A lengthy delay between access and first use often points to problems like poor visibility, ineffective onboarding, or unclear benefits.
Common friction points include:
- Low visibility: Long delays may indicate UI/UX issues making the feature hard to find.
- Complicated onboarding: Users might need better instructions or tutorials.
- Unclear benefits: The value of the feature might not be communicated effectively.
To measure this, calculate the average number of days between:
- When users first gain access.
- When they first use the feature.
Break the data into time segments for better analysis:
| Time to First Use | What It Suggests |
|---|---|
| 0-2 days | Strong discoverability and clear benefits. |
| 3-7 days | Some friction; minor tweaks may help. |
| 8-14 days | Notable barriers to adoption that need addressing. |
| 15+ days | Major issues with visibility or perceived usefulness. |
Consider additional factors like feature complexity, user roles, specific use cases, and seasonal trends when analyzing results.
3. How Often Features Get Used
Looking at how often features are used goes beyond just adoption rates - it helps you understand how engaged users really are. By analyzing usage frequency, you can identify which features are working well and which might need some adjustments.
Usage patterns generally fit into three main categories:
- High-frequency use: Shows strong interest and consistent value to users.
- Moderate use: Indicates room for improvement in visibility or ease of use.
- Low or sporadic use: Suggests users might be facing challenges or don’t find the feature helpful.
When evaluating feature usage, consider factors like user roles, the purpose of the feature, and any seasonal trends that might naturally affect engagement.
Here’s how you can boost feature engagement:
- Define baseline expectations for how often a feature should be used.
- Keep an eye on trends to catch any declines early.
- Combine usage data with direct feedback from users to get a fuller picture.
Using an analytics tool like Userlens can help uncover underused features and guide decisions for improvement. These insights provide a solid foundation for digging deeper into how much time users spend on specific features.
4. Time Spent Using Features
Analyzing how much time users spend on specific features can uncover usability problems or design hiccups. If a seemingly straightforward feature takes too long to use, it might point to a design flaw or inefficiency.
When reviewing these metrics, keep in mind the feature's complexity and how familiar users are with your product. While more complex features naturally take longer to use, extended or inconsistent usage could highlight areas where users are struggling. These patterns can help identify where adjustments are needed.
Tools like Userlens make it easier to track these metrics, allowing teams to identify features that may need simplification or clearer instructions to improve the overall user experience.
sbb-itb-6285ddb
5. Feature Usage Over Time
Tracking how features are used over weeks and months helps reveal engagement trends and identify features that may not be meeting expectations.
Feature usage patterns generally fall into three main categories:
| Usage Pattern | Description | What It Indicates |
|---|---|---|
| Steady Growth | Usage increases consistently over time | The feature is valuable and aligns with user needs. |
| Plateau | Usage spikes initially but then levels off | The feature might need improvements or better visibility. |
| Decline | Usage drops after initial adoption | There could be usability issues or the feature may no longer be relevant. |
By analyzing how often features are used and which user groups engage with them, you can uncover gaps and develop clear strategies for improvement.
For example, if a reporting feature sees declining usage during high-demand periods, it might indicate performance problems or a drop in its perceived value over time.
To track feature usage effectively:
- Establish baseline metrics for comparison.
- Keep an eye on seasonal trends.
- Study how different user groups (cohorts) interact with the feature.
- Compare its performance to similar features.
Remember, not all features are designed for constant use. Features like account settings naturally see occasional engagement. It's important to define what "healthy usage" looks like for each feature type.
Understanding these patterns allows teams to make informed decisions - whether to improve, phase out, or better promote specific features.
6. User Ratings Per Feature
User ratings shed light on how users feel about specific features, offering valuable insights into satisfaction and areas for improvement. This feedback works hand-in-hand with usage data to pinpoint what’s working well and what needs attention.
Here are three key sources for gathering feature ratings:
| Rating Source | Key Advantages | What It Shows |
|---|---|---|
| In-app Surveys | Real-time feedback in context | Satisfaction during active use |
| Feature Feedback Forms | Detailed, qualitative input | Specific issues or pain points |
| Net Promoter Score (NPS) | Overall satisfaction metric | Impact on user loyalty |
How to Evaluate Ratings
To extract meaningful insights, focus on these areas:
- Rating Distribution: Look for patterns across different user groups.
- Rating Trends: Track how ratings evolve over time.
- Rating Volume: Check how many responses you’re getting - low participation may signal visibility issues or lack of interest.
- Correlation Analysis: Compare ratings with usage data to uncover deeper insights.
Turning Ratings Into Action
Here’s how to make user ratings more impactful:
- Set clear benchmarks for each type of feature.
- Break down ratings by user roles or experience levels for a more detailed view.
- Follow up with targeted interviews after negative feedback to understand the root causes.
- Monitor ratings before and after updates to measure improvements.
Users often share feedback when they’re either very happy or highly dissatisfied. To get a balanced view, consider scheduling periodic prompts for feedback. Combining these insights with usage data provides a more complete understanding, helping you fine-tune features to better align with user needs.
7. Feature Usage Complexity
Understanding how users interact with features can reveal whether they're fully utilizing them or sticking to basic functions. This insight can guide efforts to improve user education and refine features for better engagement.
Measuring Usage Complexity
Here’s how usage complexity can be assessed:
| Complexity Level | Usage Indicators | Insights |
|---|---|---|
| Basic Usage | Single-click actions, default settings | Limited interaction with advanced capabilities |
| Intermediate | Custom configurations, saved preferences | Users begin tailoring features to their needs |
| Advanced | Keyboard shortcuts, API integrations, automation | Full utilization of feature capabilities |
Important Metrics to Track
- Feature Depth Score: Tracks the percentage of a feature's capabilities that users engage with.
- Component Attention: Highlights which parts of a feature receive the most interaction.
- Interaction Progression: Monitors how users move from basic to more advanced feature usage.
Spotting Complexity Barriers
Certain patterns can indicate that users are struggling to engage with advanced features:
- Reliance on default settings without exploring further
- Advanced features show low adoption rates over time
- Users abandon workflows when they become too complex
- Minimal customization beyond standard options
Steps to Improve Engagement
Once you've identified these barriers, take actionable steps to help users explore features more effectively:
- Gradual Feature Introduction: Begin with basic functionality and introduce advanced options over time with tailored onboarding experiences.
- In-App Learning Tools: Use tooltips, walkthroughs, or interactive tutorials to guide users toward advanced features when they're ready.
- Engagement Milestones: Encourage deeper involvement by setting clear goals:
- Basic: Complete standard workflows
- Intermediate: Customize templates
- Advanced: Automate processes
Simplifying interfaces and offering targeted education can help users unlock the full potential of your features.
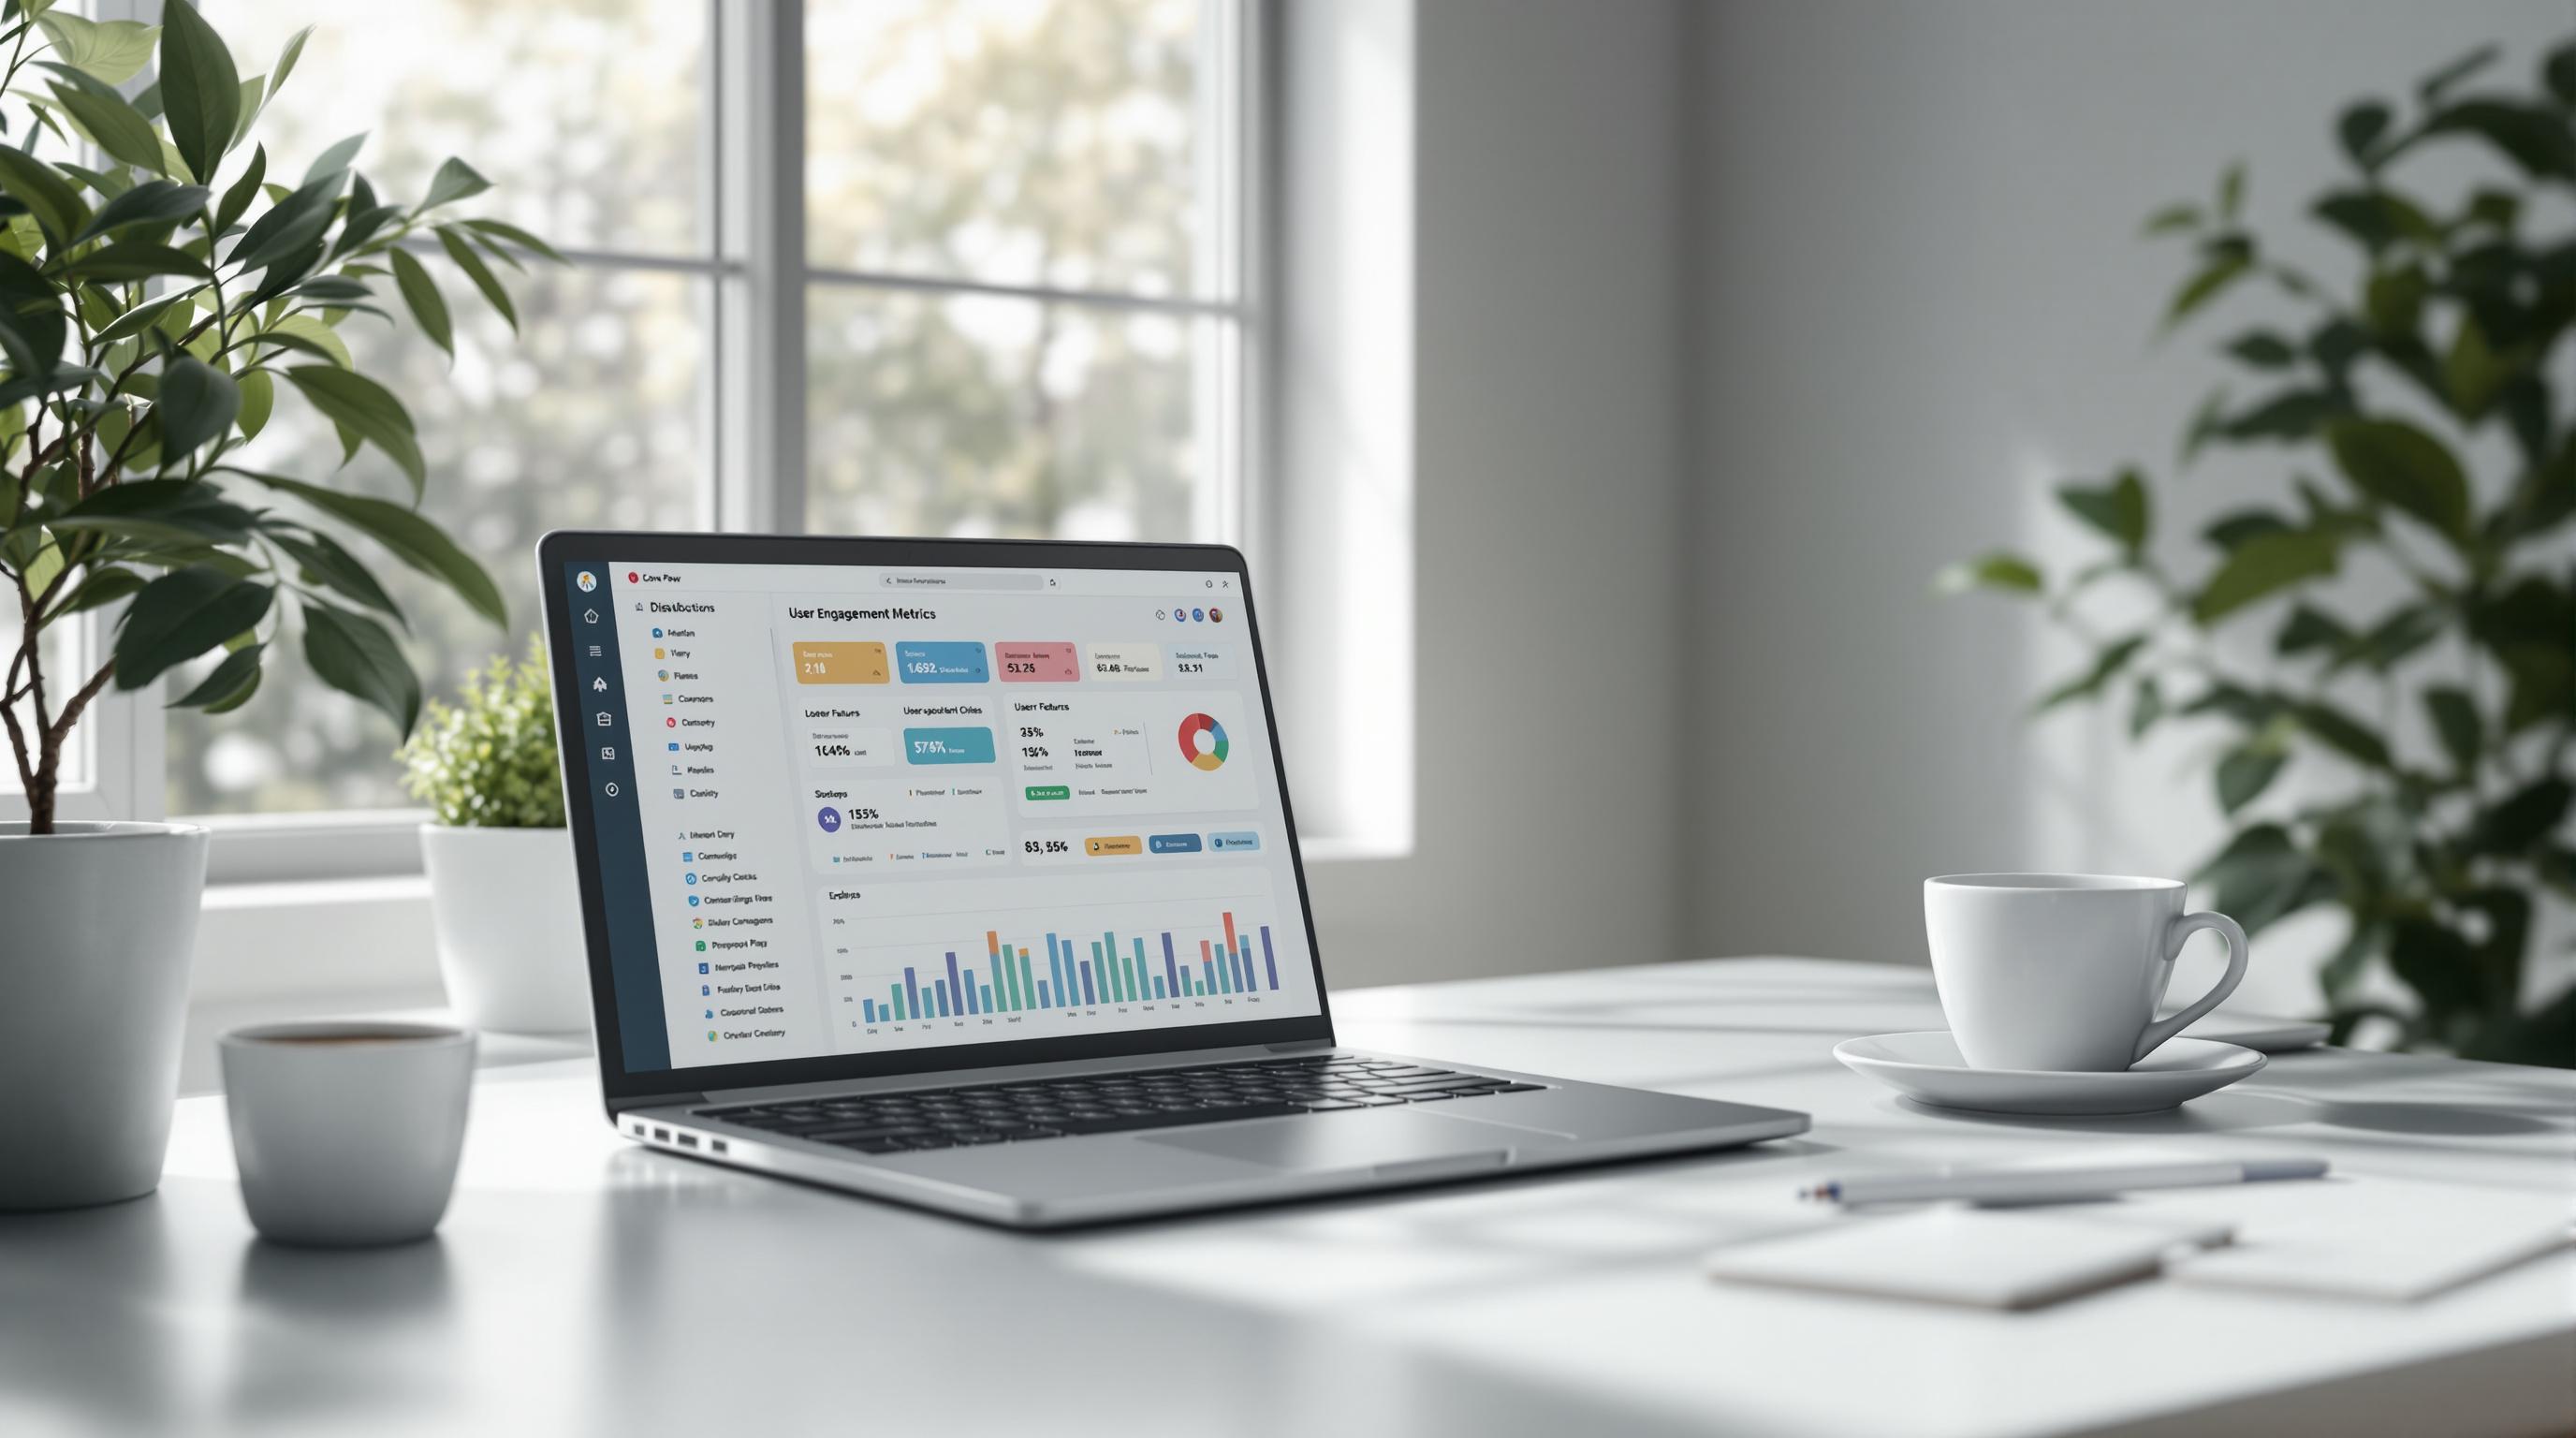
Using Userlens to Track Feature Performance

A product analytics tool like Userlens makes tracking feature usage metrics much easier. Its dashboard presents key data visually, helping teams identify features that might be underused. These insights work alongside the metrics discussed earlier, enabling more focused improvements.
Real-Time Usage Heatmaps
Userlens uses activity dots to generate heatmaps, offering a clear picture of how features are being adopted across your user base.
Unified Dashboard Analytics
The Userlens dashboard brings together essential feature metrics in one place. Whether you're analyzing the percentage of users interacting with a feature or how quickly new users engage with it, the dashboard delivers insights you can act on to refine your product.
Company-Level Usage Analysis
Userlens also provides a view of organization-wide user activity, showing overall feature adoption. This high-level perspective helps uncover usage trends and make better engagement decisions.
Wrapping It Up
Keeping track of how users interact with your features is crucial for building a successful SaaS product. With mobile apps losing up to 90% of daily users within the first 30 days, driving feature engagement is a key part of retaining users.
The seven metrics we discussed earlier provide a solid foundation for spotting and improving underused features. By focusing on these metrics, you can make informed decisions to enhance your product.
Here are a few strategies to encourage feature adoption:
- Provide in-app guidance to help users discover features
- Build user communities to encourage knowledge sharing
- Consistently track key engagement events
- Prioritize actionable metrics over surface-level ones
Did you know? Around 15% of customers are willing to pay more for excellent design. Regularly monitoring and refining your features ensures your product remains engaging and keeps delivering value.
Tools like Userlens make this process easier by offering real-time, actionable insights. Its analytics dashboards and usage heatmaps let you see how users interact with your product, helping you refine features based on real behavior.
Related posts
.svg)


.svg)
